Linear Methods for Classification
Linear Discriminant Analysis Classifier (LDAC)
See [Hastie09], page 106.
- class mlpy.LDAC
Linear Discriminant Analysis Classifier.
Initialization.
- bias()
Returns the bias. For multiclass classification this method returns a 1d numpy array where b[i] contains the coefficients of label i. For binary classification an float (b_1 - b_0) is returned.
- labels()
Outputs the name of labels.
- learn(x, y)
Learning method.
Parameters : - x : 2d array_like object
training data (N, P)
- y : 1d array_like object integer
target values (N)
- pred(t)
Does classification on test vector(s) t.
Parameters : - t : 1d (one sample) or 2d array_like object
test data ([M,] P)
Returns : - p : integer or 1d numpy array
predicted class(es)
- w()
Returns the coefficients. For multiclass classification this method returns a 2d numpy array where w[i] contains the coefficients of label i. For binary classification an 1d numpy array (w_1 - w_0) is returned.
Examples
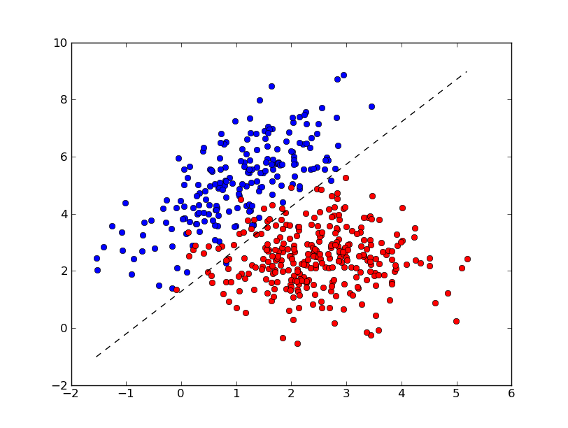
Binary classification:
>>> import numpy as np
>>> import matplotlib.pyplot as plt
>>> import mlpy
>>> np.random.seed(0)
>>> mean1, cov1, n1 = [1, 5], [[1,1],[1,2]], 200  # 200 samples of class 1
>>> x1 = np.random.multivariate_normal(mean1, cov1, n1)
>>> y1 = np.ones(n1, dtype=np.int)
>>> mean2, cov2, n2 = [2.5, 2.5], [[1,0],[0,1]], 300 # 300 samples of class -1
>>> x2 = np.random.multivariate_normal(mean2, cov2, n2)
>>> y2 = -np.ones(n2, dtype=np.int)
>>> x = np.concatenate((x1, x2), axis=0) # concatenate the samples
>>> y = np.concatenate((y1, y2))
>>> ldac = mlpy.LDAC()
>>> ldac.learn(x, y)
>>> w = ldac.w()
>>> w
array([ 2.5948979  -2.58553746])
>>> b = ldac.bias()
>>> b
5.63727441841
>>> xx = np.arange(np.min(x[:,0]), np.max(x[:,0]), 0.01)
>>> yy = - (w[0] * xx + b) / w[1] # separator line
>>> fig = plt.figure(1) # plot
>>> plot1 = plt.plot(x1[:, 0], x1[:, 1], 'ob', x2[:, 0], x2[:, 1], 'or')
>>> plot2 = plt.plot(xx, yy, '--k')
>>> plt.show()

>>> test = [[0, 2], [4, 2]] # test points
>>> ldac.pred(test)
array([-1, -1])
>>> ldac.labels()
array([-1,  1])
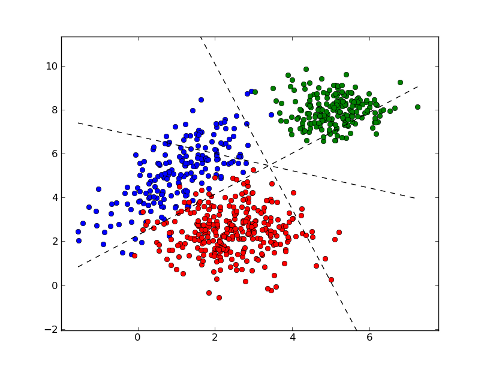
Multiclass classification:
>>> import numpy as np
>>> import matplotlib.pyplot as plt
>>> import mlpy
>>> np.random.seed(0)
>>> mean1, cov1, n1 = [1, 25], [[1,1],[1,2]], 200  # 200 samples of class 0
>>> x1 = np.random.multivariate_normal(mean1, cov1, n1)
>>> y1 = np.zeros(n1, dtype=np.int)
>>> mean2, cov2, n2 = [2.5, 22.5], [[1,0],[0,1]], 300 # 300 samples of class 1
>>> x2 = np.random.multivariate_normal(mean2, cov2, n2)
>>> y2 = np.ones(n2, dtype=np.int)
>>> mean3, cov3, n3 = [5, 28], [[0.5,0],[0,0.5]], 200 # 200 samples of class 2
>>> x3 = np.random.multivariate_normal(mean3, cov3, n3)
>>> y3 = 2 * np.ones(n3, dtype=np.int)
>>> x = np.concatenate((x1, x2, x3), axis=0) # concatenate the samples
>>> y = np.concatenate((y1, y2, y3))
>>> ldac = mlpy.LDAC()
>>> ldac.learn(x, y)
>>> w = ldac.w()
>>> w # w[i]: coefficients label ldac.labels()[i]
array([[-0.30949939  4.53041257]
       [ 2.52002288  1.50501818]
       [ 4.2499381   5.90569921]])
>>> b = ldac.bias()
>>> b # b[i]: bias for label ldac.labels()[i]
array([-12.65129158  -5.7628039  -35.63605709])
>>> xx = np.arange(np.min(x[:,0]), np.max(x[:,0]), 0.01)
>>> yy1 = (xx* (w[1][0]-w[0][0]) + b[1] - b[0]) / (w[0][1]-w[1][1])
>>> yy2 = (xx* (w[2][0]-w[0][0]) + b[2] - b[0]) / (w[0][1]-w[2][1])
>>> yy3 = (xx* (w[2][0]-w[1][0]) + b[2] - b[1]) / (w[1][1]-w[2][1])
>>> fig = plt.figure(1) # plot
>>> plot1 = plt.plot(x1[:, 0], x1[:, 1], 'ob', x2[:, 0], x2[:, 1], 'or', x3[:, 0], x3[:, 1], 'og')
>>> plot2 = plt.plot(xx, yy1, '--k')
>>> plot3 = plt.plot(xx, yy2, '--k')
>>> plot4 = plt.plot(xx, yy3, '--k')
>>> plt.show()

>>> test = [[6,7], [4, 2]] # test points
>>> ldac.pred(test)
array([2, 1])
>>> ldac.labels()
array([0, 1, 2])
Basic Perceptron
- class mlpy.Perceptron(alpha=0.10000000000000001, thr=0.0, maxiters=1000)
Perceptron binary classifier.
The algorithm stops when the iteration error is less or equal than thr, or a predetermined number of iterations (maxiters) have been completed.
Parameters : - alpha : float, in range (0.0, 1]
learning rate
- thr : float, in range [0.0, 1.0]
iteration error (e.g. thr=0.13 for error=13%)
- maxiters : integer (>0)
maximum number of iterations
- bias()
Returns the bias.
- err()
Returns the iteration error
- iters()
Returns the number of iterations
- labels()
Outputs the name of labels.
- learn(x, y)
Learning method.
Parameters : - x : 2d array_like object
training data (N, P)
- y : 1d array_like object integer (only two classes)
target values (N)
- pred(t)
Prediction method.
Parameters : - t : 1d or 2d array_like object
testing data ([M,], P)
- w()
Returns the coefficients.
Examples
>>> import numpy as np
>>> import matplotlib.pyplot as plt
>>> import mlpy
>>> np.random.seed(0)
>>> mean1, cov1, n1 = [1, 5], [[1,1],[1,2]], 200  # 200 samples of class 1
>>> x1 = np.random.multivariate_normal(mean1, cov1, n1)
>>> y1 = np.ones(n1, dtype=np.int)
>>> mean2, cov2, n2 = [2.5, 2.5], [[1,0],[0,1]], 300 # 300 samples of class -1
>>> x2 = np.random.multivariate_normal(mean2, cov2, n2)
>>> y2 = -np.ones(n2, dtype=np.int)
>>> x = np.concatenate((x1, x2), axis=0) # concatenate the samples
>>> y = np.concatenate((y1, y2))
>>> p = mlpy.Perceptron(alpha=0.1, thr=0.05, maxiters=100) # basic perceptron
>>> p.learn(x, y)
>>> w = p.w()
>>> w
array([-69.00185254,  46.49202132])
>>> b = p.bias()
>>> b
-59.600000000000001
>>> p.err()
0.050000000000000003
>>> p.iters()
46
>>> xx = np.arange(np.min(x[:,0]), np.max(x[:,0]), 0.01)
>>> yy = - (w[0] * xx + b) / w[1] # separator line
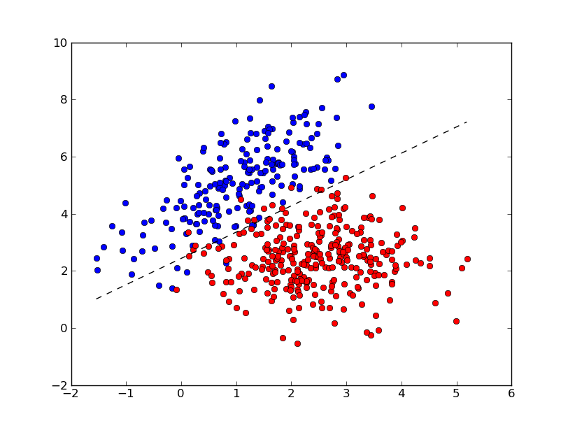
>>> fig = plt.figure(1) # plot
>>> plot1 = plt.plot(x1[:, 0], x1[:, 1], 'ob', x2[:, 0], x2[:, 1], 'or')
>>> plot2 = plt.plot(xx, yy, '--k')
>>> plt.show()

>>> test = [[0, 2], [4, 2]] # test points
>>> p.pred(test)
array([ 1, -1])
>>> p.labels()
array([-1,  1])
Elastic Net Classifier
See [Hastie09], Chapter 18, page 661.
- class mlpy.ElasticNetC(lmb, eps, supp=True, tol=0.01)
Elastic Net Regularization via Iterative Soft Thresholding for classification.
See the ElasticNet class documentation.
Initialization.
Parameters : - lmb : float
regularization parameter controlling overfitting. lmb can be tuned via cross validation.
- eps : float
correlation parameter preserving correlation among variables against sparsity. The solutions obtained for different values of the correlation parameter have the same prediction properties but different feature representation.
- supp : bool
if True, the algorithm stops when the support of beta reached convergence. If False, the algorithm stops when the coefficients reached convergence, that is when the beta_{l}(i) - beta_{l+1}(i) > tol * beta_{l}(i) for all i.
- tol : double
tolerance for convergence
- bias()
Returns the bias.
- labels()
Outputs the name of labels.
- learn(x, y)
Compute the classification coefficients.
Parameters : - x : 2d array_like object (N x P)
matrix
- y : 1d array_like object integer (1 or -1) (N)
class labels
- pred(t)
Compute the predicted labels.
Parameters : - t : 1d or 2d array_like object ([M,] P)
test data
Returns : - p : integer or 1d numpy array
predicted labels
- w()
Returns the coefficients.
Example:
>>> import numpy as np
>>> import matplotlib.pyplot as plt
>>> import mlpy
>>> np.random.seed(0)
>>> mean1, cov1, n1 = [1, 5], [[1,1],[1,2]], 200  # 200 samples of class 1
>>> x1 = np.random.multivariate_normal(mean1, cov1, n1)
>>> y1 = np.ones(n1, dtype=np.int)
>>> mean2, cov2, n2 = [2.5, 2.5], [[1,0],[0,1]], 300 # 300 samples of class -1
>>> x2 = np.random.multivariate_normal(mean2, cov2, n2)
>>> y2 = -np.ones(n2, dtype=np.int)
>>> x = np.concatenate((x1, x2), axis=0) # concatenate the samples
>>> y = np.concatenate((y1, y2))
>>> en = mlpy.ElasticNetC(lmb=0.01, eps=0.001)
>>> en.learn(x, y)
>>> w = en.w()
>>> w
array([-0.27733363,  0.30115026])
>>> b = en.bias()
>>> b
-0.73445916200332606
>>> en.iters()
1000
>>> xx = np.arange(np.min(x[:,0]), np.max(x[:,0]), 0.01)
>>> yy = - (w[0] * xx + b) / w[1] # separator line
>>> fig = plt.figure(1) # plot
>>> plot1 = plt.plot(x1[:, 0], x1[:, 1], 'ob', x2[:, 0], x2[:, 1], 'or')
>>> plot2 = plt.plot(xx, yy, '--k')
>>> plt.show()

>>> test = [[1, 4], [2, 2]] # test points
>>> en.pred(test)
array([ 1., -1.])
Logistic Regression
Support Vector Classification
Diagonal Linear Discriminant Analysis (DLDA)
See [Hastie09], page 651.
- class mlpy.DLDA(delta)
Diagonal Linear Discriminant Analysis classifier. The algorithm uses the procedure called Nearest Shrunken Centroids (NSC).
Initialization.
Parameters : - delta : float
regularization parameter
- dprime()
Return the dprime d’_kj (C, P), where C is the number of classes.
- labels()
Outputs the name of labels.
- learn(x, y)
Learning method.
Parameters : - x : 2d array_like object
training data (N, P)
- y : 1d array_like object integer
target values (N)
- pred(t)
Does classification on test vector(s) t.
Parameters : - t : 1d (one sample) or 2d array_like object
test data ([M,] P)
Returns : - p : int or 1d numpy array
the predicted class(es) for t is returned.
- prob(t)
For each sample returns C (number of classes) probability estimates.
- sel()
Returns the most important features (the features that have a nonzero dprime for at least one of the classes).
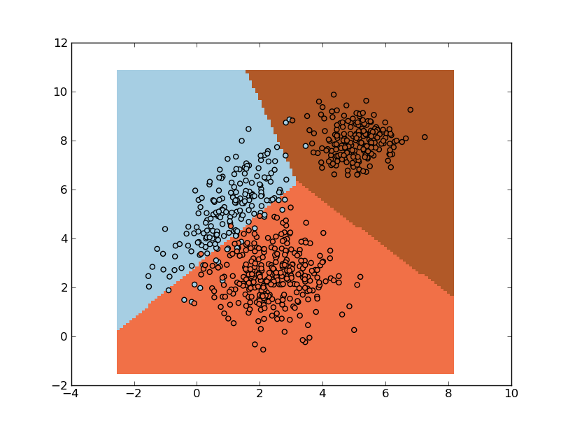
Example:
>>> import numpy as np
>>> import matplotlib.pyplot as plt
>>> import mlpy
>>> np.random.seed(0)
>>> mean1, cov1, n1 = [1, 5], [[1,1],[1,2]], 200  # 200 samples of class 0
>>> x1 = np.random.multivariate_normal(mean1, cov1, n1)
>>> y1 = np.zeros(n1, dtype=np.int)
>>> mean2, cov2, n2 = [2.5, 2.5], [[1,0],[0,1]], 300 # 300 samples of class 1
>>> x2 = np.random.multivariate_normal(mean2, cov2, n2)
>>> y2 = np.ones(n2, dtype=np.int)
>>> mean3, cov3, n3 = [5, 8], [[0.5,0],[0,0.5]], 200 # 200 samples of class 2
>>> x3 = np.random.multivariate_normal(mean3, cov3, n3)
>>> y3 = 2 * np.ones(n3, dtype=np.int)
>>> x = np.concatenate((x1, x2, x3), axis=0) # concatenate the samples
>>> y = np.concatenate((y1, y2, y3))
>>> da = mlpy.DLDA(delta=0.1)
>>> da.learn(x, y)
>>> xmin, xmax = x[:,0].min()-1, x[:,0].max()+1
>>> ymin, ymax = x[:,1].min()-1, x[:,1].max()+1
>>> xx, yy = np.meshgrid(np.arange(xmin, xmax, 0.1), np.arange(ymin, ymax, 0.1))
>>> xnew = np.c_[xx.ravel(), yy.ravel()]
>>> ynew = da.pred(xnew).reshape(xx.shape)
>>> fig = plt.figure(1)
>>> cmap = plt.set_cmap(plt.cm.Paired)
>>> plot1 = plt.pcolormesh(xx, yy, ynew)
>>> plot2 = plt.scatter(x[:,0], x[:,1], c=y)
>>> plt.show()

Golub Classifier
- class mlpy.Golub
Golub binary classifier described in [Golub99].
Decision function is D(x) = w (x-mu), where w is defined as w_i = (mu_i(+) - mu_i(-)) / (std_i(+) + std_i(-)) and mu id defined as (mu(+) + mu(-)) / 2.
[Golub99] - Golub et al. Molecular classification of cancer: Class discovery and class prediction by gene expression monitoring. Science, 1999.
Initialization.
- labels()
Outputs the name of labels.
- learn(x, y)
Learning method.
Parameters : - x : 2d array_like object
training data (N, P)
- y : 1d array_like object integer (only two classes)
target values (N)
- pred(t)
Prediction method.
Parameters : - t : 1d or 2d array_like object
testing data ([M,], P)
- w()
Returns the coefficients.
| [Hastie09] | (1, 2, 3) T Hastie, R Tibshirani, J Friedman. The Elements of Statistical Learning. Second Edition. |