Dimensionality Reduction
Linear Discriminant Analysis (LDA)
- class mlpy.LDA(method='cov')
Linear Discriminant Analysis.
Initialization.
Parameters : - method : str
‘cov’ or ‘fast’
- coeff()
Returns the tranformation matrix (P,C-1), where C is the number of classes. Each column contains coefficients for one transformation vector.
- learn(x, y)
Computes the transformation matrix. x is a matrix (N,P) and y is a vector containing the class labels. Each column of x represents a variable, while the rows contain observations.
- transform(t)
Embed t (M,P) into the C-1 dimensional space. Returns a (M,C-1) matrix.
Example:
>>> import numpy as np
>>> import matplotlib.pyplot as plt
>>> import mlpy
>>> np.random.seed(0)
>>> mean1, cov1, n1 = [1, 4.5], [[1,1],[1,2]], 20  # 20 samples of class 1
>>> x1 = np.random.multivariate_normal(mean1, cov1, n1)
>>> y1 = np.ones(n1, dtype=np.int)
>>> mean2, cov2, n2 = [2.5, 2.5], [[1,1],[1,2]], 30 # 30 samples of class 2
>>> x2 = np.random.multivariate_normal(mean2, cov2, n2)
>>> y2 = 2 * np.ones(n2, dtype=np.int)
>>> x = np.concatenate((x1, x2), axis=0) # concatenate the samples
>>> y = np.concatenate((y1, y2))
>>> lda = mlpy.LDA()
>>> lda.learn(x, y) # compute the tranformation matrix
>>> z = lda.transform(x) # embedded x into the C-1 = 1 dimensional space
Spectral Regression Discriminant Analysis (SRDA)
- class mlpy.SRDA(alpha=0.001)
Spectral Regression Discriminant Analysis.
Initialization.
Parameters : - alpha : float (>=0)
regularization parameter
- coeff()
Returns the tranformation matrix (P,C-1), where C is the number of classes. Each column contains coefficients for one transformation vector.
- learn(x, y)
Computes the transformation matrix. x is a matrix (N,P) and y is a vector containing the class labels. Each column of x represents a variable, while the rows contain observations.
- transform(t)
Embed t (M,P) into the C-1 dimensional space. Returns a (M,C-1) matrix.
Kernel Fisher Discriminant Analysis (KFDA)
- class mlpy.KFDA(lmb=0.001)
Kernel Fisher Discriminant Analysis.
Initialization.
Parameters : - lmb : float (>= 0.0)
regularization parameter
- coeff()
Returns the tranformation vector (N,1).
- learn(K, y)
Computes the transformation vector. K is a the kernel matrix (N,N) and y contains the class labels (the algorithm works only with 2 classes).
- transform(Kt)
Embed Kt (M,N) into the 1 dimensional space. Returns a (M,1) matrix.
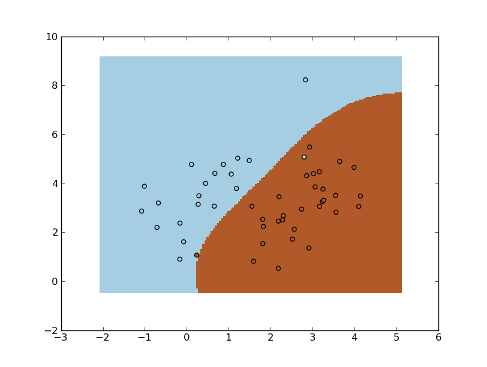
Example - KNN in kernel fisher space:
>>> import numpy as np
>>> import matplotlib.pyplot as plt
>>> import mlpy
>>> np.random.seed(0)
>>> mean1, cov1, n1 = [1, 4.5], [[1,1],[1,2]], 20  # 20 samples of class 1
>>> x1 = np.random.multivariate_normal(mean1, cov1, n1)
>>> y1 = np.ones(n1, dtype=np.int)
>>> mean2, cov2, n2 = [2.5, 2.5], [[1,1],[1,2]], 30 # 30 samples of class 2
>>> x2 = np.random.multivariate_normal(mean2, cov2, n2)
>>> y2 = 2 * np.ones(n2, dtype=np.int)
>>> x = np.concatenate((x1, x2), axis=0) # concatenate the samples
>>> y = np.concatenate((y1, y2))
>>> K = mlpy.kernel_gaussian(x, x, sigma=3) # compute the kernel matrix
>>> kfda = mlpy.KFDA(lmb=0.01)
>>> kfda.learn(K, y) # compute the tranformation vector
>>> z = kfda.transform(K) # embedded x into the kernel fisher space
>>> knn = mlpy.KNN(k=5)
>>> knn.learn(z, y) # learn KNN in the kernel fisher space
>>> xmin, xmax = x[:,0].min()-1, x[:,0].max()+1
>>> ymin, ymax = x[:,1].min()-1, x[:,1].max()+1
>>> xx, yy = np.meshgrid(np.arange(xmin, xmax, 0.05), np.arange(ymin, ymax, 0.05))
>>> xt = np.c_[xx.ravel(), yy.ravel()]
>>> Kt = mlpy.kernel_gaussian(xt, x, sigma=3) # compute the kernel matrix Kt
>>> zt = kfda.transform(Kt) # embedded xt into the kernel fisher space
>>> yt = KNN.pred(zt).reshape(xx.shape) # perform the KNN prediction in the kernel fisher space
>>> fig = plt.figure(1)
>>> cmap = plt.set_cmap(plt.cm.Paired)
>>> plot1 = plt.pcolormesh(xx, yy, yt)
>>> plot2 = plt.scatter(x[:,0], x[:,1], c=y)
>>> plt.show()
Principal Component Analysis (PCA)
- class mlpy.PCA(method='svd', whiten=False)
Principal Component Analysis.
Initialization.
Parameters : - method : str
method, ‘svd’ or ‘cov’
- whiten : bool
whitening. The eigenvectors will be scaled by eigenvalues**-(1/2)
- coeff()
Returns the tranformation matrix (P,L), where L=min(N,P), sorted by decreasing eigenvalue. Each column contains coefficients for one principal component.
- coeff_inv()
Returns the inverse of tranformation matrix (L,P), where L=min(N,P), sorted by decreasing eigenvalue.
- evals()
Returns sorted eigenvalues (L), where L=min(N,P).
- learn(x)
Compute the principal component coefficients. x is a matrix (N,P). Each column of x represents a variable, while the rows contain observations.
- transform(t, k=None)
Embed t (M,P) into the k dimensional subspace. Returns a (M,K) matrix. If k =None will be set to min(N,P)
- transform_inv(z)
Transform data back to its original space, where z is a (M,K) matrix. Returns a (M,P) matrix.
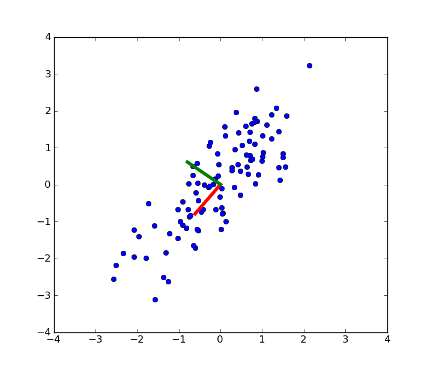
Example:
>>> import numpy as np
>>> import matplotlib.pyplot as plt
>>> import mlpy
>>> np.random.seed(0)
>>> mean, cov, n = [0, 0], [[1,1],[1,1.5]], 100
>>> x = np.random.multivariate_normal(mean, cov, n)
>>> pca.learn(x)
>>> coeff = pca.coeff()
>>> fig = plt.figure(1) # plot
>>> plot1 = plt.plot(x[:, 0], x[:, 1], 'o')
>>> plot2 = plt.plot([0,coeff[0, 0]], [0, coeff[1, 0]], linewidth=4, color='r') # first PC
>>> plot3 = plt.plot([0,coeff[0, 1]], [0, coeff[1, 1]], linewidth=4, color='g') # second PC
>>> xx = plt.xlim(-4, 4)
>>> yy = plt.ylim(-4, 4)
>>> plt.show()
>>> z = pca.transform(x, k=1) # transform x using the first PC
>>> xnew = pca.transform_inv(z) # transform data back to its original space
>>> fig2 = plt.figure(2) # plot
>>> plot1 = plt.plot(xnew[:, 0], xnew[:, 1], 'o')
>>> xx = plt.xlim(-4, 4)
>>> yy = plt.ylim(-4, 4)
>>> plt.show()

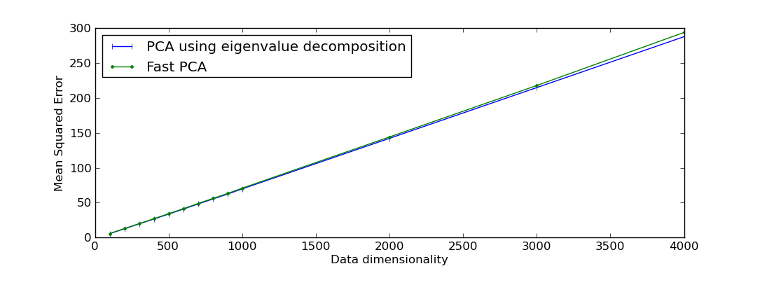
Fast Principal Component Analysis (PCAFast)
Fast PCA implementation described in [Sharma07].
- class mlpy.PCAFast(k=2, eps=0.01)
Fast Principal Component Analysis.
Initialization.
Parameters : - k : integer
the number of principal axes or eigenvectors required
- eps : float (> 0)
tolerance error
- coeff()
Returns the tranformation matrix (P,K) sorted by decreasing eigenvalue. Each column contains coefficients for one principal component.
- coeff_inv()
Returns the inverse of tranformation matrix (K,P), sorted by decreasing eigenvalue.
- learn(x)
Compute the firsts k principal component coefficients. x is a matrix (N,P). Each column of x represents a variable, while the rows contain observations.
- transform(t)
Embed t (M,P) into the k dimensional subspace. Returns a (M,K) matrix.
- transform_inv(z)
Transform data back to its original space, where z is a (M,K) matrix. Returns a (M,P) matrix.
Example reproducing Figure 1 of [Sharma07]:
>>> import numpy as np
>>> import matplotlib.pyplot as plt
>>> import mlpy
>>> np.random.seed(0)
>>> h = 10 # dimension reduced to h=10
>>> n = 100 # number of samples
>>> d = np.array([100, 200, 300, 400, 500, 600, 700, 800, 900, 1000, 2000, 3000, 4000]) # number of dimensions
>>> mse_eig, mse_fast = np.zeros(len(d)), np.zeros(len(d))
>>> pca = mlpy.PCA(method='cov') # pca (eigenvalue decomposition)
>>> pca_fast=  mlpy.PCAFast(k=h) # fast pca
>>> for i in range(d.shape[0]):
...     x = np.random.rand(n, d[i])
...     pca.learn(x) # pca (eigenvalue decomposition)
...     y_eig = pca.transform(x, k=h) # reduced dimensional feature vectors
...     xhat_eig = pca.transform_inv(y_eig) # reconstructed vector
...     pca_fast.learn(x) # pca (eigenvalue decomposition)
...     y_fast = pca_fast.transform(x) # reduced dimensional feature vectors
...     xhat_fast = pca_fast.transform_inv(y_fast) # reconstructed vector
...     for j in range(n):
...         mse_eig[i] += np.sum((x[j] - xhat_eig[j])**2)
...         mse_fast[i] += np.sum((x[j] - xhat_fast[j])**2)
...     mse_eig[i] /= n
...     mse_fast[i] /= n
...
>>> fig = plt.figure(1)
>>> plot1 = plt.plot(d, mse_eig, '|-b', label="PCA using eigenvalue decomposition")
>>> plot2 = plt.plot(d, mse_fast, '.-g', label="Fast PCA")
>>> leg = plt.legend(loc = 'best')
>>> xl = plt.xlabel("Data dimensionality")
>>> yl = plt.ylabel("Mean Squared Error")
>>> plt.show()
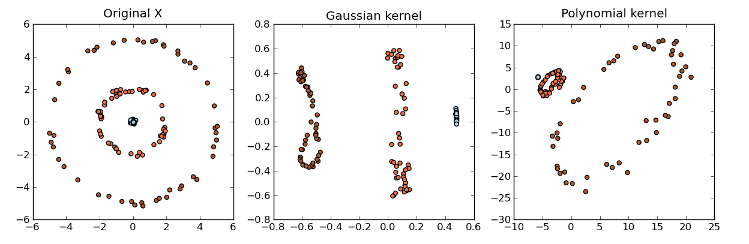
Kernel Principal Component Analysis (KPCA)
- class mlpy.KPCA
Kernel Principal Component Analysis.
Initialization.
- coeff()
Returns the tranformation matrix (N,N) sorted by decreasing eigenvalue.
- evals()
Returns sorted eigenvalues (N).
- learn(K)
Compute the kernel principal component coefficients. K is the kernel matrix (N,N).
- transform(Kt, k=None)
Embed Kt (M,N) into the k dimensional subspace. Returns a (M,K) matrix.
Example:
>>> import numpy as np
>>> import matplotlib.pyplot as plt
>>> import mlpy
>>> np.random.seed(0)
>>> np.random.seed(0)
>>> x = np.zeros((150, 2))
>>> y = np.empty(150, dtype=np.int)
>>> theta = np.random.normal(0, np.pi, 50)
>>> r = np.random.normal(0, 0.1, 50)
>>> x[0:50, 0] = r * np.cos(theta)
>>> x[0:50, 1] = r * np.sin(theta)
>>> y[0:50] = 0
>>> theta = np.random.normal(0, np.pi, 50)
>>> r = np.random.normal(2, 0.1, 50)
>>> x[50:100, 0] = r * np.cos(theta)
>>> x[50:100, 1] = r * np.sin(theta)
>>> y[50:100] = 1
>>> theta = np.random.normal(0, np.pi, 50)
>>> r = np.random.normal(5, 0.1, 50)
>>> x[100:150, 0] = r * np.cos(theta)
>>> x[100:150, 1] = r * np.sin(theta)
>>> y[100:150] = 2
>>> cmap = plt.set_cmap(plt.cm.Paired)
>>> gK = mlpy.kernel_gaussian(x, x, sigma=2) # gaussian kernel matrix
>>> pK = mlpy.kernel_polynomial(x, x, gamma=1.0, b=1.0, d=2.0) # polynomial kernel matrix
>>> gaussian_pca = mlpy.KPCA()
>>> polynomial_pca = mlpy.KPCA()
>>> gaussian_pca.learn(gK)
>>> polynomial_pca.learn(pK)
>>> gz = gaussian_pca.transform(gK, k=2)
>>> pz = polynomial_pca.transform(pK, k=2)
>>> fig = plt.figure(1)
>>> ax1 = plt.subplot(131)
>>> plot1 = plt.scatter(x[:, 0], x[:, 1], c=y)
>>> title1 = ax1.set_title('Original X')
>>> ax2 = plt.subplot(132)
>>> plot2 = plt.scatter(gz[:, 0], gz[:, 1], c=y)
>>> title2 = ax2.set_title('Gaussian kernel')
>>> ax3 = plt.subplot(133)
>>> plot3 = plt.scatter(pz[:, 0], pz[:, 1], c=y)
>>> title3 = ax3.set_title('Polynomial kernel')
>>> plt.show()
| [Cai08] | D Cai, X He, J Han. SRDA: An Efficient Algorithm for Large-Scale Discriminant Analysis. Knowledge and Data Engineering, IEEE Transactions on Volume 20, Issue 1, Jan. 2008 Page(s):1 - 12. |
| [Sharma07] | (1, 2) A Sharma, K K Paliwal. Fast principal component analysis using fixed-point algorithm. Pattern Recognition Letters 28 (2007) 1151–1155. |
| [Mika99] | S Mika et al. Fisher Discriminant Analysis with Kernels. Neural Networks for Signal Processing IX, 1999. Proceedings of the 1999 IEEE Signal Processing Society Workshop. |
| [Scholkopf96] | B Scholkopf, A Smola, KR Muller. Nonlinear Component Analysis as a Kernel EigenValue Problem |